Get Complete Project Material File(s) Now! »
Instrument Design and Concept
In the RPA, the test material is held in a sealed biconical cavity, thus under pressurized conditions, and submitted to harmonic torsional strain. The resulting torque is measured and through the appropriate built-in data treatment, split into real and imaginary components in order to yield dynamic viscoelastic data, such as G’ and G’’. The instrument is designed for easy loading of highly viscous materials, and for operating in the industrial environment, i.e. it is a compact test device, with an easy access test chamber and all provisions for safe handling. Whilst prototypes were operating and evaluated in selected laboratories by the late eighties, presentations of the instrument with practical demonstrations of its testing capabilities were made in the early 1990’s [17,20].
Instrument description and operation
Essentially the RPA consists of two main parts: the test instrument itself and an outside (PC) computer for test monitoring, data recording and treatment. The testing part consists in a biconical test chamber with grooved dies to avoid slippage. The cavity is closed through the action of a ram operated with a pressure of 40 bar (4 MPa) and a slight excess of test material is needed for reliable torque reading to be made. Two hard fluoroelastomer seals provide the peripheral closure of the cavity. The excess material flows in a circular spew channel and further contributes to the sealing of the cavity. Tests are thus made in pressurized conditions, and therefore porosity does not develop in the sample when the instrument is operated as a curemeter. The lower die can be oscillated (in torsion) at controlled strain and frequency. The advantage of this test geometry is that the strain rate is constant in the gap (which is not the case with parallel plate devices).
The torque measuring system is attached to the upper die and calibrated with a torsion spring mounted between the two dies. The heart of the instrument is a special direct drive motor, which can move the lower die sinusoidally over a wide range of strains and frequencies. The temperature control system has a resolution to the nearest 0.1°C which, combined with the thinness of the sample, allows near isothermal tests to be performed in the 40-200°C range (note : this range depends on the instrument model). Temperature changes are very quick and monitored by the controlling computer. The RPA test cavity is not exactly biconical but consists of a flat central portion of 7.6 mm diameter that determine truncated conical dies of 41.25 mm diameter and angle 3°35’ (or 3.58° = 0.0625 radian) (see Figure 2.3 for dimensions). The periphery of the cavity consists of two hard fluoroelastomer seals with an angle β = 30° with respect to the mid plan. There are grooves in the upper and lower dies in order to prevent slippage of the tested material.
Test protocols for strain sweep experiments
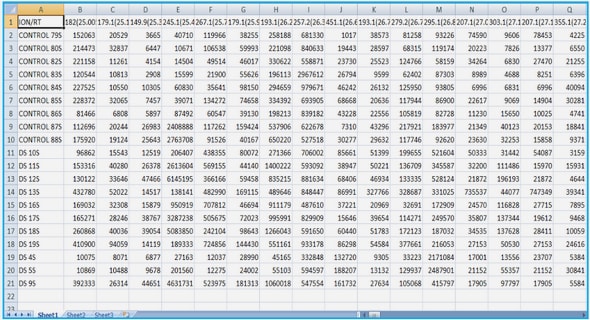
Strain sweep are performed with the RPA, according to protocols given in Table 2.10.
Each protocol describes strain sweep experiments through two subsequent runs separated by a resting period of 2 min. At least two samples of the same material are tested, using protocols named “S-sweep_05Hz_A” and “S-sweep_05Hz_B” such that, through inversion of the strain sequences (i.e. run 1 and run 2), sample fatigue effects would be detected, if any. At each strain sweep step, data acquisition is made in order to record 10240 points at the rate of 512 pt/s. At 0.5 Hz test frequency, twenty cycles are consequently recorded at each strain step, with the RPA set to apply a sufficient number of cycles (i.e. 40 cycles; the so-called “stability” condition) for the steady harmonic regime to be reached. An experiment lasts some 23 minutes and two samples are tested in such a manner that the strain sequences of the successive runs are inverted, with the strain range documented by 20 experimental points. Differences are expected between runs 1 and 2 for materials sensitive to strain amplitude. This experimental approach was designed in order to obtain the maximum number of data in the shortest test time (less than one hour), whilst documenting in the meantime the test repeatability and the material homogeneity.
1.Introduction
1.1 Natural Rubber world context and technology
1.2 Nonlinear viscoelastic characterization
1.3 Scope and objectives of the work
1.4 References Section 1
2. Natural Rubber : test materials and test techniques
2.1 Natural Rubber; general description
2.1.1 RSS (Ribbed Smoked Sheets)
2.1.2 RSS (Ribbed Smoked Sheets) Process
2.1.3 RSS grades description
2.2. Technically specified natural rubber (TSR) – Standard rubber
2.2.1 Technically specified natural rubber (TSR) Processes
2.2.1.1 Latex Process
2.2.1.2 Cup-lump Process
2.2.2 Standard Specification for NR Technical Grades
2.3 Materials used in this study
2.4 Test techniques for macromolecular characteristics
2.4.1 Analytical techniques
2.4.1.1 Differential Scanning Calorimetry (DSC)
2.4.1.2 Nuclear magnetic resonance (NMR)
2.4.1.3 Raman Spectroscopy
2.4.1.4 SEC-MALS for Molecular Weight measurements
2.4.2 Gel content measurement
2.4.2.1 Gel assessment techniques in literature
2.4.2.2 Measuring Gel content with respect to extraction kinetics
2.5 Processing techniques
2.5.1 Mastication effects with a Banbury mixer
2.5.2 Compounding with a Haake mixer
2.5.3 Two rolls mixer
2.5.4 Compression molding for test plaques
2.6 Rheometrical test techniques
2.6.1 Mooney viscometer
2.2.6.1 Test specimen preparation
2.2.6.2 Measuring Mooney viscosity
2.6.2 Rubber Process Analyzer
2.6.2.1 Instrument Design and Concept
2.6.2.2 Instrument description and operation
2.6.2.3 Measuring Principle and Operating Range
2.6.3 Fourier Transform rheometry
2.6.3.1 Test protocols for strain sweep experiments
2.6.3.2 Fourier transform analysis
2.6.3.3 Modeling the effect of strain amplitude on FT rheometry results
2.7 Mechanical testing
2.7.1 Tensile testing
2.7.2 Hardness
2.8 References Section 2
3 Experimental results
3.1 Gum samples analysis results
3.1.1 DSC analysis
3.1.2 NMR analysis
3.1.3 Raman analysis
3.1.4 Sol and gel contents
3.1.5 RPA results on gum NR samples
3.1.5.1 Complex modulus versus strain
3.1.5.2 Quarter torque signal integration
3.1.5.3 Torque harmonics vs. Strain
3.1.6 Conclusions Section 3.1
3.2 Studying mastication effects on selected NR grades
3.2.1 Effect of mastication on gel content and molecular weight
3.2.2 RPA results on masticated NR samples
3.2.2.1 Complex modulus versus strain
3.2.2.2 Quarter torque signal integration
3.2.2.3 Torque harmonics vs. Strain
3.2.3 Conclusions Section 3.2
3.3 Compounding – NR samples
3.3.1 RPA tests on compounded rubber
3.3.1.1 Complex modulus versus strain
3.3.1.2 Quarter torque signal integration
3.3.1.3 Torque harmonics vs. strain
3.3.2 Physical properties of cured rubber
3.3.3 Conclusions Section 3.3
3.4 References Section 3
4. Overall conclusions