Get Complete Project Material File(s) Now! »
LITERATURE REVIEW AND THEORITICAL FRAMEWORK
The aim of this section is to present literatures relevant to this research and to provide a theoretical framework. The chapter begins with a review of definitions and some measurements of customer satisfaction and service quality, and then follows by the relationship between customer satisfaction and service quality which leads to the conceptual frame work of the study. Identification of variables and formulation of hypothesis end the chapter.
Customer satisfaction
Those who buy the goods or services provided by companies are customers. In other words, a customer is a stakeholder of an organization who provides payment in exchange for the offer provided to him by the organization with the aim of fulfilling a need and to maximise satisfaction. Sometimes the term customer and consumer are confusing. A customer can be a consumer, but a consumer may not necessarily be a customer. Another author explained this difference. I.e. a customer is the person who does the buying of the products and the consumer is the person who ultimately consumes the product (Solomon, 2009, p. 34.)
When a consumer/customer is contented with either the product or services it is termed satisfaction. Satisfaction can also be a person’s feelings of pleasure or disappointment that results from comparing a product’s perceived performance or outcome with their expectations (Kotler & Keller, 2009, p. 789). As a matter of fact, satisfaction could be the pleasure derived by someone from the consumption of goods or services offered by another person or group of people; or it can be the state of being happy with a situation. Satisfaction varies from one person to another because it is utility. “One man’s meal is another man’s poison,” an old adage stated describing utility; thus highlighting the fact that it is sometimes very difficult to satisfy everybody or to determine satisfaction among group of individuals.
Client happiness, which is a sign of customer satisfaction, is and has always been the most essential thing for any organization. Customer satisfaction is defined by one author as “the consumer’s response to the evaluation of the perceived discrepancy between prior expectations and the actual performance of the product or service as perceived after its consumption” (Tse & Wilton, 1988, p. 204) hence considering satisfaction as an overall post-purchase evaluation by the consumer” (Fornell, 1992, p. 11).
Some authors stated that there is no specific definition of customer satisfaction, and after their studies of several definitions they defined customer satisfaction as “customer satisfaction is identified by a response (cognitive or affective) that pertains to a particular focus (i.e. a purchase experience and/or the associated product) and occurs at a certain time (i.e. post-purchase, post-consumption)”. (Giese & Cote, 2000, p. 15) This definition is supported by some other authors, who think that consumer’s level of satisfaction is determined by his or her cumulative experience at the point of contact with the supplier (Sureshchander et al., 2002, p. 364). It is factual that, there is no specific definition of customer satisfaction since as the years passes, different authors come up with different definitions. Customer satisfaction has also been defined by another author as the extent to which a product’s perceived performance matches a buyer’s expectations (Kotler et al., 2002, p. 8). According to Schiffman & Karun (2004) Customer satisfaction is defined as “the individual’s perception of the performance of the products or services in relation to his or her expectations” (Schiffman & Karun 2004, p. 14). In a nutshell, customer satisfaction could be the pleasure obtained from consuming an offer.
Measuring customer satisfaction could be very difficult at times because it is an attempt to measure human feelings. It was for this reason that some existing researcher presented that “the simplest way to know how customers feel, and what they want is to ask them” this applied to the informal measures (Levy, 2009, p. 6; NBRI, 2009).
Levy (2009, p. 6) in his studies, suggested three ways of measuring customer satisfaction:
• A survey where customer feedback can be transformed into measurable quantitative data:
• Focus group or informal where discussions orchestrated by a trained moderator reveal what customers think.
• Informal measures like reading blocs, talking directly to customers.
Asking each and every customer is advantageous in as much as the company will know everyone’s feelings, and disadvantageous because the company will have to collect this information from each customer (NBRI, 2009). The National Business Research Institute (NBRI) suggested possible dimensions that one can use in measuring customer satisfaction, e.g.:
• quality of service
• Innocently
• speed of service
• pricing
• complaints or problems
• trust in your employees
• the closeness of the relationship with contacts in your firm
• other types of services needed
• your positioning in clients’ minds.
There exist two conceptualizations of customer satisfaction; transaction-specific and cumulative (Boulding, et al., 1993; Andreassen, 2000). Following the transaction-specific, customer satisfaction is viewed as a post-choice evaluation judgement of a specific purchase occasion (Oliver, 1980 ) until present date, researchers have developed a rich body of literature focusing on this antecedents and consequences of this type of customer satisfaction at the individual level (Yi, 1990). Cumulative customer satisfaction is an overall evaluation based on the total purchase and consumption experiences with a product or service over time. (Fornell, 1992, Johnson & Fornell 1991) This is more fundamental and useful than transaction specificity customer satisfaction in predicting customer subsequent behaviour and firm’s past, present and future performances. It is the cumulative customer satisfaction that motivates a firm’s investment in customer satisfaction.
Service quality
In order for a company’s offer to reach the customers there is a need for services. These services depend on the type of product and it differs in the various organizations. Service can be defined in many ways depending on which area the term is being used. An author defines service as “any intangible act or performance that one party offers to another that does not result in the ownership of anything” (Kotler & Keller, 2009, p. 789). In all, service can also be defined as an intangible offer by one party to another in exchange of money for pleasure.
Quality is one of the things that consumers look for in an offer, which service happens to be one (Solomon 2009, p. 413). Quality can also be defined as the totality of features and characteristics of a product or services that bear on its ability to satisfy stated or implied needs (Kotler et al., 2002, p. 831). It is evident that quality is also related to the value of an offer, which could evoke satisfaction or dissatisfaction on the part of the user.
Service quality in the management and marketing literature is the extent to which customers’ perceptions of service meet and/or exceed their expectations for example as defined by Zeithaml et al. (1990), cited in Bowen & David, 2005, p. 340) Thus service quality can intend to be the way in which customers are served in an organization which could be good or poor. Parasuraman defines service quality as “the differences between customer expectations and perceptions of service” (Parasuraman, 1988). They argued that measuring service quality as the difference between perceived and expected service was a valid way and could make management to identify gaps to what they offer as services.
The aim of providing quality services is to satisfy customers. Measuring service quality is a better way to dictate whether the services are good or bad and whether the customers will or are satisfied with it. A researcher listed in his study: “three components of service quality, called the 3 “Ps” of service quality” (Haywood 1988, p. 19-29). In the study, service quality was described as comprising of three elements:
• “Physical facilities, processes and procedures;
• Personal behaviour on the part of serving staff, and;
• Professional judgment on the part of serving staff but to get good quality service. “Haywood 1988, p. 19-29).
He stated that “an appropriate, carefully balanced mix of these three elements must be achieved.” (Haywood, 1988, p. 9-29) What constitutes an appropriate mix, according to him will, in part, be determined by the relative degrees of labour intensity, service process customization, and contact and interaction between the customer and the service process. From the look of things, this idea of his could be design to fit with evaluating service quality with the employee perspective.
One of the most useful measurements of service quality is the dimensions from the SERVQUAL model. In the creation of this model for the very first time, “Parasuraman et al. (1985) identified 97 attributes which were condensed into ten dimensions; they were found to have an impact on service quality and were regarded as the criteria that were important to access customer’s expectations and perceptions on delivered service (Kumar et al., 2009, p. 214).
The SERVQUAL scale which is also known as the gap model by Parasuraman, et al. (1988) has been proven to be one of the best ways to measure the quality of services provided to customers. This service evaluation method has been proven consistent and reliable by some authors (Brown et al., 1993). They held that, when perceived or experienced service is less than the expected service; it implies less than satisfactory service quality; and when perceived service is more than expected service, the obvious inference is that service quality is more than satisfactory (Jain et al., 2004, p. 27). From the way this theory is presented, it seems the idea of SERVQUAL best fits the evaluation of service quality form the customer perspective. This is because when it is stated “perceived” and “expected” service, it is very clear that this goes to the person, who is going to or is consuming the service; who definitely is the consumer/customer.
The original study by Parasuraman et al., (1988) presented ten dimensions of service quality.
¬ Tangibles: the appearance of physical artefacts and staff members connected with the service (accommodation, equipment, staff uniforms, and so on).
¬ Reliability: the ability to deliver the promised service.
¬ Responsiveness: the readiness of staff members to help in a pleasant and effective way.
¬ Competence: the capability of staff members in executing the service.
¬ Courtesy: the respect, thoughtfulness, and politeness exhibited by staff members who are in contact with the customer.
¬ Credibility: the trustworthiness and honesty of the service provider.
¬ Security: the absence of doubt, economic risk, and physical danger.
¬ Access: the accessibility of the service provider.
¬ Communication: an understandable manner and use of language by the service provider.
¬ Understanding the customer: efforts by the service provider to know and understand the customer.
In first SERVQUAL model that came had 22 pairs of Likert-type items, where one part measured perceived level of service provided by a particular organization and the other part measured expected level of service quality by respondent. (Kuo-YF, 2003, p. 464-465). Further investigation led to the finding that, among these 10 dimensions, some were correlated. After refinement, these ten dimensions above were later reduced to five dimensions as below:
Tangibility: physical facilities, equipment, and appearance of personnel
Reliability: ability to perform the promised service dependably and accurately
Responsiveness: willingness to help customers and provide prompt service
Assurance: knowledge and courtesy of employees and their ability to inspire trust and Confidence
Empathy: caring individualized attention the firm provides to its customers
The aggregated sum of difference between perceptions and expectations from the five dimensions forms the global perceive quality construct. (Laroche et al., 2004, p. 363) Following this view, customers’ expectations were met through the outcome dimension (reliability) and exceed it by means of the process dimension (tangibility, assurance, responsiveness, and empathy).
To confirm the validity of SERVQUAL model in the evaluation of service quality, Zeithaml et al (2006), stated that “service quality is a focused evaluation that reflects the customer’s perception of reliability, assurance, responsiveness, empathy, and tangibles” (Zeithaml et al., 2006, p. 106-107). They added that among these dimensions, “reliability” has been shown consistently to be the most important dimension in service quality (Zeithaml et al., 2006, p. 106-107).
Other researchers saw the need of additional components of service expectations that is functional and technical dimensions. (Grönroos 1983) The idea was that, consumers make service evaluations based on the technical dimension that is what is delivered and on the functional dimension that is how, why, who, and when it is delivered. (Laroche et al., 2004 p. 363: Grönroos 1983).
Although the elements listed in SERVQUAL model have been proven to be the main method for evaluating service quality from the consumer’s perspective (Brown et al., 1993), drawbacks in using SERVQUAL in measuring service quality has been the reason that the SERVPERF scale was proposed by Cronin & Taylor (1992, cited in Jain et al. (2004, p. 25-37) after they called into question the conceptual basis of the SERVQUAL, having found it, led to confusion with service satisfaction (Jain et al., 2004, p. 25-37). These researchers discarded the ´E´ for ´expectation` claiming instead that ´P´ for ´performance´ alone should be used. They meant that higher perceived performance entails higher quality service. Unfortunately, during this past century, customers have changed their behaviours in ways that do not suit organizational behaviour. Till date, it is unclear as to which of SERVQUAL and SERVPERF is superior in measuring service quality (Jain et al., 2004, p. 25-37).
Laroche et al., (2004) made an assessment of the dimensionality of should and will service expectations. They used a survey measuring customers’ post encounter expectations and vis-à-vis a well-known airline with a sample of 363 and examined the existence of hypothesized functional and technical dimensions of should and will expectations and determined the casual relationships between two types of expectations and hypothesized dimensions. They tested their dimensions in the context of the turbulent airline industry. This study measured service quality with other service quality dimensions such as technical and functional dimensions proposed by Grönross (1983). Hence it was proven that the SERVQUAL model must not be used in evaluating service quality in all organizations. This could mean that; different industries might require different measurements for service quality.
Customer satisfaction and service quality
Since customer satisfaction has been considered to be based on the customer’s experience on a particular service encounter, (Cronin & Taylor, 1992) it is in line with the fact that service quality is a determinant of customer satisfaction, because service quality comes from outcome of the services from service providers in organizations. Another author stated in his theory that “definitions of consumer satisfaction relate to a specific transaction (the difference between predicted service and perceived service) in contrast with ‘attitudes’, which are more enduring and less situational-oriented,” (Lewis, 1993, p. 4-12) This is in line with the idea of Zeithaml et al (2006, p. 106-107). Regarding the relationship between customer satisfaction and service quality, Oliver (1993) first suggested that service quality would be antecedent to customer satisfaction regardless of whether these constructs were cumulative or transaction-specific. Some researchers have found empirical supports for the view of the point mentioned above (Anderson & Sullivan, 1993; Fornell et al 1996; Spreng & Macky 1996); where customer satisfaction came as a result of service quality.
In relating customer satisfaction and service quality, researchers have been more precise about the meaning and measurements of satisfaction and service quality. Satisfaction and service quality have certain things in common, but satisfaction generally is a broader concept, whereas service quality focuses specifically on dimensions of service. (Wilson et al., 2008, p. 78). Although it is stated that other factors such as price and product quality can affect customer satisfaction, perceived service quality is a component of customer satisfaction (Zeithaml et al. 2006, p. 106-107). This theory complies with the idea of Wilson et al. (2008) and has been confirmed by the definition of customer satisfaction presented by other researchers.
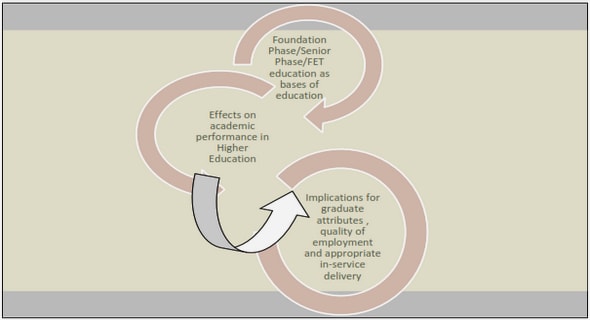
The above figure shows the relationship between customer satisfaction and service quality. The author presented a situation that service quality is a focused evaluation that reflects the customer’s perception of reliability, assurance, responsiveness, empathy and tangibility while satisfaction is more inclusive and it is influenced by perceptions of service quality, product quality and price, also situational factors and personal factors. (Wilson, 2008, p. 78)
It has been proven from past researches on service quality and customer satisfaction that Customer satisfaction and service quality are related from their definitions to their relationships with other aspects in business. Some authors have agreed to the fact that service quality determines customer satisfaction. Parasuraman et al., (1985) in their study, proposed that when perceived service quality is high, then it will lead to increase in customer satisfaction. Some other authors did comprehend with the idea brought up by Parasuraman (1995) and they acknowledged that “Customer satisfaction is based upon the level of service quality that is provided by the service providers” (Saravana & Rao, 2007, p. 436, Lee et al., 2000, p. 226). Looking into (figure 1), relating it to these authors’ views, it is evident that definition of customer satisfaction involves predicted and perceived service; since service quality acted as one of the factors that influence satisfaction. More evidence of this relationship has been proven by past researches.
As a result of the definition of customer satisfaction presented by Lewis, (1993, p. 4-12), Sivadas & Baker-Prewitt (2000, p. 73-82) used a national random telephone survey of 542 shoppers to examine the relationship between service quality, customer satisfaction, and store loyalty within the retail department store context. One of the results was that service quality influences relative attitude and satisfaction with department stores. They found out that there is a relationship between customer satisfaction and service quality.
In line with the findings of Sivadas & Baker-Prewitt (2000, p. 73-82), Su et al., (2002, p. 372) in their study of customer satisfaction and service quality, found out that; these two variables are related, confirming the definitions of both variables which have always been linked. They also dictated that service quality is more abstract because it may be affected by perceptions of value or by the experiences of others that may not be so good, than customer satisfaction which reflects the customer’s feelings about many encounters and experiences with service firm. (Su et al., 2002, p. 372).
In addition to what the other researchers have found out from customer satisfaction and service quality, some other authors Wang & Hing-Po (2002), went into details to bring in customer value in the study of the relationship between customer satisfaction and service quality. Their study used SERVQUAL model in measuring service quality in China’s mobile phone market, but with modification on the basis of focus group discussions and expert opinions to reflect the specific industry attributes and the special culture of China. Emphasis was then paid to the study of the dynamic relationships among service quality, customer value, customer satisfaction and their influences on future behaviours after the key drivers of customer value and customer satisfaction were identified. All of them were based on the development of structural equation models by using PLS-GRAPH Package. (Wang & Hing-Po, 2002 p. 50-60) This study blended the study of customer satisfaction and service quality with customer value which added more weight to the linkage between customer satisfaction and service quality because value is what customers look in an offer.
Past studies on the relationship between customer satisfaction and service quality which included SERVQUAL dimension have been published since from 2003 to 2010, the research on this topic droped from 2004 to 2006 and was stable, between 2008 and 2009, there was no study on this field of study that treated the relationship between customer satisfaction and service quality with SERVQUAL dimension; research on this topic increased rapidly in 2010 (Appendix 1).
With regards to the above statistics; Kuo ( 2003) conducted a research on service quality of virtual community websites with the purpose of constructing an instrument to evaluate service quality of virtual community websites and to have a further discussion of the relationship between service quality dimensions and overall service quality, customer satisfaction and loyalty. The researcher used Factor analysis, t-test, and Pearson correlation analysis to analyse the data collected from college students of three major universities in Taiwan. One of the results was that” on-line quality and information safety is positively related to the overall service quality, customer satisfaction, and loyalty, but the service quality level of this dimension was the poorest. ” (Kuo, 2003, 461-473).
In contrast to the above studies; Bennett & Barkensjo (2005) studied relationship quality, relationship marketing, and client perceptions of the levels of service quality of charitable organisations. Questions were asked to 100 people on their perceptions of service quality of the organisations that had given them assistance, their satisfaction with a charity service etc. they constructed a model and estimated using the method of partial least square. Also, perceived service quality was measured via adaptations of the SERVQUAL instrument but without any assessments of the respondents’ prior expectations concerning the services they would receive from an organisation. In their results, relationship marketing was found to represent an effective weapon for improving both relationship quality and beneficiaries’ satisfaction with service provision. They stated that “relationship quality and actual service quality induced beneficiaries to want to recommend a charity to other people and to engage in positive word-of-mouth.” (Bennett & Barkensjo, 2005, p. 101).
Meaning the beneficiaries who stood as the customers were satisfied since recommendation is signal of satisfaction, confirming the idea that service quality is related to customer satisfaction. They were not directly conducting a research on the relationship between customer satisfaction and service quality, but because when talking about client perceptions, one must think of their satisfaction, and when talking about service quality there is a link between these two as has been proven by many researchers ( Baker-Prewitt, 2000, p. 73-82; Kuo-YF, 2003, 461-473; Gera, 2011, p. 2-20) This means it could be useful to test these three variables (Customer satisfaction, service quality and Service quality dimensions). The study of Bennett & Barkensjo (2005) stated that “the hypothesis elements of SERVQUAL model (Tangible, assurance etc.) were scientifically associated with the service quality construct” (Bennett & Barkensjo, 2005, p. 101). It could be interesting to test SERVQUAL model with the five dimensions and service quality assuming that expectations is included to see if it will be significantly associated.
In support of the use of SERVQUAL in the relationship between customer satisfaction and service quality, Ahmed et al., (2010) conducted a mediation of customer satisfaction relationship between service quality and repurchase intentions for the telecom sector among university students, with SERVQUAL model’s 5 dimensions (tangibles, responsiveness, empathy, assurance and reliability) by Parasuraman et al. to measure service quality.
To crown the fact that customer satisfaction and service quality are important variables in business research on customers, Gera (2011) investigated the link between service quality, value, satisfaction and behavioural intentions in a public sector bank in India and one of their results states that “Service quality was found to significantly impact on customer satisfaction and value perceptions” (Gera, 2011, p. 2-20).
The literature review shows latest researches up to 2011 on the relationship between customer satisfaction and service quality. The researches in this area have been covered so far as below;
• It has been researched that there is a relationship between customer satisfaction and service quality.
• It has been researched that service quality could be evaluated with the use of SERVQUAL model.
• It has been researched that service quality could be evaluated by other dimensions of service quality that is, functional and technical and not necessarily SERVQUAL model
• Some researchers even tested service quality and service quality dimensions.
What is lacking is the relationship between customer satisfaction and service quality dimensions. Among all the recent articles that I could reach, none of the studies had tested the five dimensions of SERVQUAL and customer satisfaction and service quality at the same time to confirm this relationship between customer satisfaction and service quality.
Conceptual Frame work
The aim of this section is to summarise the idea I got from past literature and to bring out the contributions I have for this study area. Thus this part starts with the idea generated and the contribution follows.
The general idea from the past literature is that there is a relationship between customer satisfaction and service quality; also that service quality could be evaluated with the use of five service quality dimensions and the most useable is the SERVQUAL scale.
Following the two clarifications about the different views of customer satisfaction of a customer of either being transaction-specific or cumulative (Boulding et al., 1993; Andreassen, 2000). My theoretical frame work treats customer satisfaction as transaction-specific. Thus, customers in this paper are those who consume the services, satisfaction denotes customer’s desire to maintain a business relationship with the organization and it is also the feelings of the customers towards the services provided to them by the organizations; while customer satisfaction in this study is the pleasures obtained by customers for the services provided to them by the employees of the organizations.
It has been proven that “perceived service quality is a component of customer satisfaction” (Ziethaml et al. 2006, p.106-107). Other researchers had proven also that there is a relationship between customer satisfaction and service quality (Sivadas & Baker-Prewitt, 2000, p. 73-82; Wang et al., 2002, p. 50-60; Kuo-YF, 2003, Liang & Zhang, 2009, p. 113-12, Gera, 2011, p. 2-20; Sureshchandar, et al., 2002 p. 363-379). Moreover, the SERVQUAL model has been proven to be the best model to measure service quality in service sectors especially with the customer perspective. This idea generates an assumption that the five dimensions of SERVQUAL model could have a direct relationship with customer satisfaction. (Figure 2) The questions that arose from this assumption is that ´Is there a significant relationship between customer satisfaction and service quality dimensions? ´; `Is there a significant relationship between customer satisfaction and service quality?`
Also, it has been stated that service quality is the overall assessment of a service by the customers, (Eshghi et al., 2008, p.121). Also, the five dimension of SERVQUAL model has been proven to be the main yardstick used by most of the researchers in the evaluation of service quality (Wilson et al., 2008, p. 79; Bennett & Barkensjo, 2005, p. 101, Negi, 2009; Wang & Hing-Po, 2002). This idea generates an assumption that each of the five dimensions of SERVQUAL model could have a direct relationship with service quality. (Figure 2) The question that arose from this assumption is that: ´Is there a significant relationship between Service quality and the five dimensions of SERVQUAL model? `
Table of contents :
CHAPTER 1: INTRODUCTION
1.1. INTRODUCTORY BACKGROUND
1.1.1. Importance of Customer satisfaction
1.1.2. Reasons for researching in this area
1.2. PROBLEM FORMULATION
1.3. RESEARCH QUESTION
1.4. PURPOSE OF THE STUDY
1.5. DELIMITATION
1.6. STRUCTURE OF THE THESIS
CHAPTER 2: LITERATURE REVIEW AND THEORITICAL FRAMEWORK
2.1. CUSTOMER SATISFACTION
2.2. SERVICE QUALITY
2.3. CUSTOMER SATISFACTION AND SERVICE QUALITY
2.4. CONCEPTUAL FRAME WORK
CHAPTER 3: METHODOLOGY
3.1. AUTHOR’S PRECONCEPTIONS
3.2. CHOICE OF SUBJECT
3.3. PERSPECTIVE OF THE THESIS
3.4. RESEARCH PHILOSOPHIES
3.5. RESEARCH APPROACHES
3.6. SAMPLING TECHNIQUE AND STRATIFICATION
3.7. RESEARCH STRATEGY AND DESIGN
3.8. RESEARCH DATA, DATA CAPTURE INSTRUMENT, COLLECTION METHOD
3.9 DATA CLEANING
3.10. DATA ANALYSIS PROCEDURE
3.11. VALIDITY AND RELIABILITY
3.12. ETHICAL CONSIDERATIONS
CHAPTER 4: EMPIRICAL FINDINGS AND ANALYSIS
4.1. UMEA UNIVERSITY
4.1.1. Sample presentation for Umeå University
4.1.2: Variables presentation for Umeå University
4.1.3: Variables and Sample characteristics for Umeå University
4.1.4. Statistical Tests for Umeå University
4.2. ICA ÅLIDHEM CENTRUM
4.2.1 Sample presentation for ICA Ålidhem Centrum
4.2.2. Variable characteristics for ICA Ålidhem Centrum
4.2.3. Variable and Sample characteristics for ICA
4.2.4. Statistical Test for ICA Ålidhem
4.3. FOREX BANK
4.3.1 Sample Characteristics for Forex
4.3.2. Variable presentation for FOREX
4.3.3 Variables and sample characteristics for Forex bank
4.3.4. Statistical Test for Forest Bank
4.4. GROUP PRESENTATION
4.4.1. Group Sample population and Characteristics
4.4.2. Group Variables presentation
4.4.3. Group Variables and Sample characteristics
4.4.4. Statistical Test for Group data
4.5. SUMMARY OF RESULTS FROM THE STUDY
4.6. VALIDITY, RELIABILITY, REPLICABILITY AND GENERALIZABILITY FOR THE STUDY
4.7. DISCUSSION
CHAPTER 5: CONCLUSIONS, IMPLICATION AND SUGGESTIONS
5.1. CONCLUSION
5.2. IMPLICATION
5.3. LIMITATIONS
5.4 SUGGESTIONS FOR FUTURE RESEARCH
REFERENCES
APPENDIX