Get Complete Project Material File(s) Now! »
Clinical data warehouse of the Greater Paris university hospitals
In this PhD thesis, we relied on data from the clinical data warehouse (CDW), in French Entrepôt de Données de Santé (EDS), of the AP-HP (Assistance Publique – Hôpitaux de Paris). This CDW gathers data from millions of patients across 39 hospitals of the Greater Paris area.
In this chapter, we first provide some general information about the AP-HP CDW (Section 1.1). We then describe the APPRIMAGE project, within which this PhD was carried out (Section 1.2). We finally describe the different data management procedures that were carried out as part of the present PhD thesis as well as the resulting dataset (Section 1.3).
Clinical data warehouse of the Greater Paris area
One of the first CDW in France was launched in 2017 by the AP-HP, which gathers 39 hospitals of the Greater Paris area (Daniel and Salamanca, 2020). AP-HP obtained the authorization of the CNIL in 2017 (Commission Nationale de l’informatique et des Libertés, the French regulatory body for data collection and management) to share data for research purposes in compliance with the MR004 reference methodology (Daniel and Salamanca, 2020). The MR004 reference controls data processing for the purpose of studying, evaluat-ing and/or researching that does not involve human patients (in the sense of not involving an intervention or a prospective collection of research data in patients that would not be nec-essary for clinical evaluation, but which allows retrospective use of data previously acquired in patients). The goals of the CDW are the development of decision support algorithms, the support of clinical trials and the promotion of multi-centre studies.
According to French regulation, and as authorised by the CNIL, patients’ consent to use their data in the projects of the CDW can be waived as these data were acquired as part of the clinical routine care of the patients. At the same time, AP-HP committed to keep patients updated about the different research projects of the CDW through a portal on the internet (https://eds.aphp.fr/recherches-en-cours) and individual information is systematically provided to all the patients admitted to the AP-HP. In addition, a retro-spective information campaign was conducted by the AP-HP in 2017: it involved around 500,000 patients who were contacted by e-mail and by postal mail to be informed of the development of the CDW.
Accessing the data is possible with the following procedure. A detailed project must be submitted to the Scientific and Ethics Board of the AP-HP. If the project participants are external to AP-HP, they have to sign a contract with the Clinical Research and Innovation Board (Direction de la Recherche Clinique et de l’Innovation). The project must include the goals of the research, the different steps that will be pursued, a detailed description of the data needed, of the software tools necessary for the processing, and a clear statement of the public health benefits.
Once the project is approved, the research team is granted access to the Big Data Platform (BDP), which was created by a sub-department of the IT of the AP-HP, called Innovation and Data Division – I&D- (in French Pôle Innovation et Données). The BDP is a platform internal to the AP-HP where data are collected and that external users can access to perform all their analyses, in accordance with the CNIL regulation. It is strictly forbidden to export any kind of data and each user can access only a workspace that is specific to their project. Each person of the research team can access the BDP with an AP-HP account after two-factor authentication. If the research team includes people that are not employed by the AP-HP, a temporary account associated to the project is activated.
Data organization within the Big Data Platform
The CDW is composed of electronic health records (EHR) gathered using different software tools installed in the hospitals (i.e. PACS for imaging data and ORBIS for clinical data). The role of the I&D is to gather all the data of the projects from the hospitals’ software tools and to make them available for the users in the BDP. The I&D department of the AP-HP created an internal PACS (called “research PACS”) where they copied data from each hospital’s software tools.
Once the data are gathered in the research PACS, they are stored, for long-term use, in the BDP after having been pseudonymized by the AP-HP I&D department.
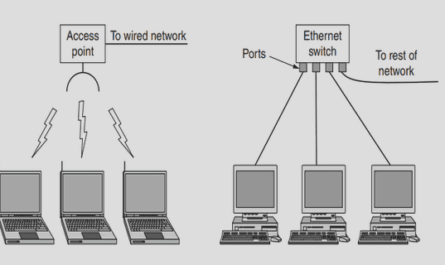
Technology-wise, the BDP runs under a Hadoop big data framework1. As such, data are stored on HDFS which is the Hadoop Distributed File System. Data on HDFS can be queried/processed using only Hadoop tools, such as HiveQL2 or Spark3, which were installed in the cluster machines of the BDP. The BDP cluster includes machines with CPUs and/or GPUs, where programming languages such as Python/R are available. Research teams can access the cluster machines and these tools through a JupyterLab environment. All the elements described and their interactions are presented in Figure 1.1.
In order to define the population of the project, the first step was the identification of all the images of interest. The I&D department listed all the DICOM attributes from the hospital PACS referring to MRI data. A neuroradiologist part of the APPRIMAGE project manually selected the DICOM attributes limited to those referring to 3D T1w brain MRI. More details are provided in Chapter 2. In this way a first selection of the cohort was created, which consisted of around 130,000 patients and 200,000 3D T1w brain MRIs acquired from 1980 to nowadays in the 39 hospitals of the AP-HP.
Data set and data management for the present PhD project
Data available in the cluster machines are stored in HDFS and accessible through Hadoop tools. We used HiveQL in order to collect data of interest and we saved them locally on the NAS (i.e. network-attached storage, a file-level data storage server connected to a network). HiveQL is a Hadoop tool designed to process data in HDFS in a structured form. Data in HDFS can be seen in the form of Hive tables. Once data were in the NAS, we could process them on CPUs and GPUs using Python and the software tools installed.
Software installation
The project was based on Python and we installed several specific libraries, the most impor-tant ones being: pytorch (Paszke et al., 2019), scikit-learn (Pedregosa et al., 2011), nilearn (Abraham et al., 2014), pydicom (Mason, 2011), ipywidgets4. Regarding the neuroimaging software tools, we installed in the BDP the following: Clinica5 (Routier et al., 2021), ANTs (Avants et al., 2014), SPM standalone (Ashburner and Friston, 2005) and dcm2niix (Li et al., 2016).
Imaging data
Imaging data are stored in the medical PACS of the different hospitals of the AP-HP. The creation of the research PACS was necessary to preserve the medical PACS and ensure that the original images do not become corrupted. To avoid overloading the medical PACS, I&D could copy a limited number of images per day into the research PACS. Images of the APPRIMAGE project were made available by batch while stored in HDFS. They can be seen as Hive tables. In Hive tables, each line represents a single DICOM file. The columns of the Hive table are the following: series uid (unique id of the series representing a single image), study uid (unique id representing the whole study during which the sequence was acquired; for a single study one can have several series/images), patient num (unique id of the patient), visit num (unique code of the visit during which the study was undertaken), dicom data (binary file with all the DICOM data). DICOM in the research PACS are pseudonymized: information about the patient such as name, age, sex, weight as well as information about the physicians who requested and analysed the results of the examination are erased, and the examination date is shifted of a random amount of time (from 1 to 10 years). Note that the same shifting is applied to all the dates of the clinical data.
Difficulties encountered in obtaining exploitable data
For about a year and half, we worked closely with the I&D department in order to obtain exploitable 3D T1w brain MRI. We encountered two different types of problems: the conver-sion from DICOM to NIfTI format was not possible with dcm2niix (Li et al., 2016), nor the previous version of the software called dcm2nii, because the information about the position of the patient had been erased in the DICOM header, or the conversion to NIfTI worked but a large part of the brain was always missing because of missing DICOM slices (detected also by the software tools used for the conversion). The I&D department released two versions of their research PACS and three versions of the pseudonymization procedure in 18 months. Every time they did a modification, we converted and visually checked around 1,000 images to give them a feedback.
Images currently available
Once the two main problems described above were solved, two batches of images were made available.
• Batch 1 contains around 11,000 3D T1W brain MRI. Images were randomly sampled from all the hospitals of the AP-HP and the different MRI machines. They were used for the study presented in Chapter 2 about quality control and for the study in Chapter 3 about feature homogenization.
• Batch 2 contains the 3D T1w brain MRI of the patients hospitalized and registered in ORBIS (more details in the next section). They were used for the study presented in Chapter 4 about the detection of patients with dementia.
Table of contents :
Introduction
Computer-aided diagnosis of brain disorders
Computer-aided diagnosis of neurodegenerative diseases: current challenges
Use of clinical data warehouse for the development of CAD in a clinical setting
Contributions
Outline of the manuscript
1 Clinical data warehouse of the Greater Paris university hospitals
1.1 Clinical data warehouse of the Greater Paris area
1.1.1 Data organization within the Big Data Platform
1.2 The APPRIMAGE project
1.3 Data set and data management for the present PhD project
1.3.1 Software installation
1.3.2 Imaging data
1.3.2.1 Difficulties encountered in obtaining exploitable data
1.3.2.2 Images currently available
1.3.2.3 Visualization of the images
1.3.3 Access to the clinical data
1.3.3.1 Analysis of clinical data
2 Automatic quality control of brain T1-weighted magnetic resonance images for a clinical data warehouse
2.1 Introduction
2.2 Material and Methods
2.2.1 Dataset description
2.2.2 Image preprocessing
2.2.3 Manual labeling of the dataset
2.2.3.1 Quality criteria
2.2.3.2 Annotation set-up
2.2.3.3 Consensus label
2.2.4 Automatic quality control method
2.2.4.1 Network architecture
2.2.4.2 Experiments
2.3 Results
2.3.1 Manual quality control
2.3.2 Automatic quality control
2.4 Discussion
2.5 Conclusion
3 Homogenization of brain MRI from a clinical data warehouse using contrastenhanced to non-contrast-enhanced image translation
3.1 Introduction
3.2 Materials and methods
3.2.1 Data set description
3.2.2 Image preprocessing
3.2.3 Network architecture
3.2.3.1 3D U-Net like structures
3.2.3.2 Conditional GANs
3.2.4 Experiments and validation measures
3.2.4.1 Synthesis accuracy
3.2.4.2 Segmentation fidelity
3.3 Results
3.3.1 Synthesis accuracy
3.3.2 Segmentation fidelity
3.4 Discussion
3.5 Conclusion
4 Detection of patients with dementia using T1w brain MRI in a clinical data warehous
4.1 Introduction
4.2 Materials
4.2.1 Research data set
4.2.2 Clinical routine data set
4.2.2.1 Imaging and clinical data collection
4.2.2.2 Definition of the different classes from ICD-10 codes
4.2.2.3 Selection of patients belonging to the dementia category
4.2.2.4 Selection of the patients belonging to the no dementia with lesions (NDL) and no dementia no lesions (NDNL) categories
4.2.2.5 Final cohorts
4.2.2.6 Training subsets
4.3 Methods
4.3.1 Image pre-processing
4.3.2 Synthesis of images without gadolinium
4.3.3 Machine learning models used for classification
4.3.3.1 Linear SVM
4.3.3.2 CNN architectures
4.3.4 Experimental setting
4.3.4.1 Training framework
4.3.4.2 Evaluation setting
4.4 Results
4.4.1 Performance in a research data set
4.4.2 Performance in the clinical data set
4.4.2.1 Influence of gadolinium injection and image quality on the classification performance
4.4.2.2 Classification performance obtained after gadolinium removal using image translation
4.4.2.3 Classification performance when training on a research data set or on an unbiased clinical data set
4.5 Discussion
4.6 Conclusion
Conclusion and Perspectives