Get Complete Project Material File(s) Now! »
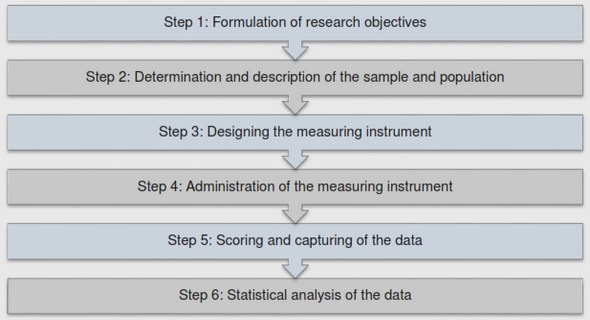
Measurements and data collection
Data was extracted from patient records for each of the patients included in the study. The data sources utilised were nursing notes and record sheets, medication administration sheets, vital sign and glucose monitoring sheets as well as physicians’ clinical notes. All capillary blood glucose measurements and blood pressure measurements were recorded from patients’ records for day one, three, seven and the last day of admission.
The outcome measures were: The mean blood glucose of patients on the first, third and seventh full day of hospitalisation and the time to glycaemic control. Glycaemic control was defined as the mean of all capillary glucose measured in 24 hours less than 10 mmol/L. The number of hospital days until glycaemic control was achieved was recorded. The proportion of patients who achieved glycaemic control according to the above mentioned criteria at discharge were determined. The number of inpatient hypoglycaemic events was counted for each patient. Hypoglycaemia was defined as finger prick blood glucose of less than 4 mmol/L.10 Other patient information that was collected included: age, gender, reasons for admission, treatment before admission, unit and discipline admitted to, duration of diabetes since diagnosis, length of hospital stay, and patient outcome.
Statistical analysis
Data was captured electronically in a Microsoft Access database. Statistical analysis was done utilising SPSS 17 for Windows (SPSS Inc, 2008) and STATA 12 statistical software (StataCorp. 2011. Stata Statistical Software: Release 12. College Station, TX: StataCorp LP). All proportions are reported as percentages and continuous variables are reported as means and standard deviations (SD) except where data is ordinal or skew in which case it is reported as medians and inter-quartile ranges (IQR).
The analysis within each audit was done comparing. blood glucose change (delta) of day 1 to day 3 and day 3 to day 7 with a paired t-test.
Comparison between audit one and two were done as follows:
The repeated mean daily glucose profiles over time (day1, day 3 and day 7) were analysed using a covariance pattern model in STATA. Firstly, a saturated model including all the clinically important variables and the audit*time interaction was compiled. Based on Wald tests the fixed effects with highest p values were dropped from the model. An exchangeable covariance structure was used utilising maximum likelihood estimation. The model with and without the interaction term was assessed with a likelihood ratio test. Least square means contrasts between the two audits at different times were tested using the contrast option after the mixed model.
Secondly, the difference in time from admission to glycaemic control between the two audits was determined using survival analysis with Cox-proportional hazards modelling. For this analysis glycaemic control was defined as a mean blood glucose of all glucose measurements done per day, less than 10 mmol/L.
CHAPTER 1
Importance of inpatient hyperglycaemia
CHAPTER 2
Inpatient blood glucose management of diabetic patients in a large secondary hospital
CHAPTER 3
Survey of knowledge and attitudes regarding diabetic inpatient management by medical and nursing staff at Kalafong Hospital
CHAPTER 4
Management of inpatients with diabetes who are able to eat meals: An audit before and after the implementation of a standardised inpatient management protocol.
CHAPTER 5
Diagnosis and treatment of diabetic ketoacidosis
CHAPTER 6
Fluid Management in diabetic-acidosis: Ringer’s lactate versus normal saline: A randomised controlled trial
SUMMARY
CONCLUDING REMARKS