Get Complete Project Material File(s) Now! »
Well-Behaved Connections
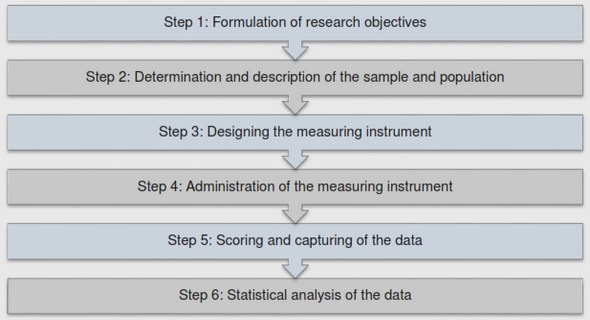
While analyzing the performance of TCP transfers, we focused on the connections that correspond to valid and complete transfers from the TCP perspective. Specifically, well-behaved TCP connections must fulfill the following conditions : (i) A complete three-way handshake ; (ii) At least one TCP data segment in each direction ; (iii) The connection must finish either with a FIN or RESET flag.
When applying the above heuristics for our traces, we are left with a total of over 35,000 TCP connections when summing over the three traces. The DSL trace is the one offering the smallest fraction of well-behaved connections, 5873 over 37,790, because of a large number of unidirectional transfers (SYN without a reply). The short duration of the trace also impacts this value as for a lot of cases, we do not observe the beginning or the end (or both) of the connection. P2p applications tend to generate such abnormal connections (contacting a non available p2p server to download a content) as well as malicious activities.
Figure 2.1 depicts the cumulative distribution of well-behaved connection size using bytes and data packets for the 3 traces. We observe that the Eurecom and Portland traces offer a similar connection profile that significantly differs from the DSL trace. For instance, 65% of the DSL connections are less than 1 Kbytes and 25% are between 1 Kbytes and 1 Mbytes, unlike Portland and Eurecom traffic which offers larger values at similar connection percentiles. A reason behind this observation, again, is the small duration of the DSL trace. However, our focus is on short transfers, and from this perspective, the DSL trace offers valuable information. While Eurecom and Portland traces present different types of traffic (wired and wireless), they have roughly the same cumulative distribution of bytes. Secondly, considering the cumulative distribution of connection size in terms of data packets, we observe that the traces present the same shape until transfer size of 10 data packets. After this value, the DSL trace increases faster to reach 95% of connection for less than 20 data packets.
When focusing on the performance of TCP transfers, the number of data packets to be transfered is a key element to consider, as it impact the ability of TCP to recover using the Fast Retransmit/ Recovery mechanism. We can already observe from Figure 2.1 that irrespectively of the trace, a significant portion of connections (between 53% and 65%) have less than 7 data packets.
Transfer Time Break-Down
To understand the factors that affect the performance of TCP transfers, we rely on the following decomposition in Figure 2.2 of each transfer into 3 different phases :
Set-up time : this is the time between the first control packet and the first data packet. Since we consider only transfers which have a complete three-way handshake, the first packet is a SYN packet while the last one is a pure ACK in general. The connection set-up time is highly correlated to the RTT of the connection. For the three traces we consider, we have a correlation coefficient of 70% for the DSL trace, 60% for the Portland trace, and 39% for the Eurecom trace.
Data transfer time : this is the time between the first and the last data packet observed in the connection. Note that it includes loss recovery durations, if any.
Tear-down time : this is the time between the last data packet and the last control packet of the connection. We impose, as explained in Section 2.2, that at least one FIN or one RESET be observed, but there can be multiple combinations of those flags at the end of the transfer. Unlike set-up, tear down is not only a function of the RTT of the connection, but also a function of the application on top of TCP. For instance, the default setting of an Apache Web server is to allow persistent connection but with a keep alive timer of 15 seconds, which means that if the user does not post a new GET request after 15 seconds, the connection is closed. A consequence of the rela31 tion between the tear-down time and the application is a weak correlation between tear-down times and RTT in our traces : 40% for the DSL trace (which is still quite high), 0.7% for the Portland trace, and -2% for the Eurecom trace.
Using the above decomposition, we analyze next, the impact of losses (Section 2.4.1) and of the application (Section 2.5) on the data transfer time.
Synchronism and Losses
For client/server applications, one often observes that even if the server is sending a large amount of bytes/packets, the actual exchange is fragmented : the server sends a few packets (hereafter called a train of packets), then waits for the client to post another request and then sends itsnext answer. If such a behavior is predominant in TCP transfers, it can have a detrimental impact if ever the train size is too small as it might prevent TCP from performing FR/R in cases of losses. When we observe passively a connection, we see data flowing in both directions, i.e., each direction sends in turn a train of packets. This is not necessarily harmful if the two parties are not synchronized, i.e. if one party does not need to receive packets from the other party before sending
its next train of packets. However, we observed that the two parties are apparently most of the time
synchronised, i.e. that they have to wait for a signal from the other side before sending their next train of packets.
The question we raise is thus : are the two parties involved in a transfer synchronized or not ? Proving synchronism requires an a priori knowledge of the application semantics. We can however prove that the synchronism hypothesis cannot be rejected as follows : for a given transfer, each time we observe a transition from one side sending packets, say A, to the other side sending packets, say B, we observe if the first packet from B acknowledges the reception of the last packet from A.
If this is not the case, then there is no synchronism, otherwise, synchronism can not be rejected. Applying this methodology to the three traces, we obtained that for each trace, the fraction of connections for which synchronism could not be rejected was extremely high : 88.6% for the ADSL trace, 94.4% for the Portland trace and 95.3% for the Eurecom trace.
For the connections for which synchronism could not be rejected, we looked at the distribution of the size of the trains of packets sent. We distinguished between the initiator of the connection and the remote party, as we expect the latter to be some kind of server that usually sends larger amount of packets than the former that simply posts requests. As illustrated by Figure 2.7 :
– Trains size sent by the remote part are larger than those sent by the initiator, in line with our hypothesis that the remote party be a server ;
– More than 97% of initiator trains are less than 3 data packets, which leaves TCP unable to trigger any Fast Retransmit, even if Limited Transmit is used ;
– More than 75% of remote party trains are less than 3 data packets, which again leaves TCP unable to trigger the fast recovery/retransmit, even if limited transmit is used. Taking a broader perspective, the fraction of connections that have a maximum train size of 3 packets is 85.2% for the DSL trace, 40.5% for the Portland trace and 54% for the Eurecom trace.
Sizes of those connections remain quite in line with our definition of Section 2.3 We observe for our traces that over 97% of those connections have less than 20 packets.
Table of contents :
List of Figures
List of Tables
Acronyms
Introduction 1
1 Overview of Challenges
1.1 Introduction
1.2 Short TCP flows
1.2.1 Definition of Short TCP flows
1.2.2 Short TCP Performance Analysis
1.2.3 Harmful Scenarios for Short TCP Performance
1.3 Performance Analysis
1.3.1 The Challenge of Comparing Performance of Different Access Technologies
1.3.1.1 Wired Networks
1.3.1.2 Wireless Networks
1.4 Enterprise Networks
1.4.1 Measurement Process
1.4.2 Preliminary Analysis
1.5 How to Detect TCP Performance Anomalies ?
1.5.1 Internet Traffic
1.5.2 Enterprise Traffic
1.6 Intrabase
1.7 Overview of Datasets
1.7.1 Heterogeneous Environments
1.7.2 Traces from Orange ISP
1.7.2.1 Applications and Performance
1.7.3 Enterprise Traffic
1.7.3.1 Applications Break-Down
1.8 Conclusion
2 Revisiting the Performance of TCP Transfers
2.1 Introduction
2.2 Well-Behaved Connections
2.3 Short Transfers : Definition
2.4 Transfer Time Break-Down
2.4.1 Recovery and Tear-down
2.5 Application Impact
2.6 Synchronism and Losses
2.7 Conclusion
3 Profiling Cellular Applications
3.1 Introduction
3.2 Impact of Core Network Equipments
3.2.1 RTT Estimation
3.2.1.1 Impact of Active Devices
3.3 Mail and Webmail : Characteristics and Usage
3.3.1 Service Identification
3.3.2 Usage and Popularity
3.3.3 Application Level Throughput
3.4 Detailed Performance Comparison
3.4.1 Connections Size
3.4.2 Impact of Application on Top
3.4.3 Losses
3.5 Conclusion
4 A First Look on Key Performance Parameters
4.1 Introduction
4.2 Traffic Stability
4.2.1 Data Volume
4.3 Usual Suspects
4.3.1 Exchanged Data Volume
4.3.2 Access
4.3.3 Data Packet Retransmission
4.4 How Applications Free TCP Connections ?
4.4.1 FIN vs RST flags
4.4.2 Diversity of Thresholds
4.5 Performance Comparison Challenge
4.6 Conclusion
5 Methodology : The Interplay Between Application, Behaviors and Usage
5.1 Introduction
5.2 Methodology
5.3 How to Present Results ?
5.3.1 Crude Representation
5.3.2 Clustering Approach
5.4 Conclusion
6 Validation of Data Time Break-down and Clustering Techniques
6.1 Introduction
6.2 Network Setup
6.3 Macroscopic Connection Time Break-down : Set-up and Data Time
6.4 Microscopic Connection Time Break-down : Think and Data Preparation Time .
6.4.1 Simulation results
6.4.2 Real-life Traces
6.5 Clustering Validation
6.5.1 Single Application Scenario
6.5.2 Heterogeneous Scenario
6.6 Comparison with RCA Technique
6.7 Throughput Computation Methods
6.8 Conclusion
7 A Fine Grained Analysis of TCP Performance
7.1 Introduction
7.2 The Case of Google Search Traffic
7.2.1 Problem Statement
7.2.1.1 Connection Size
7.2.1.2 Latency
7.2.1.3 Packet Loss
7.2.1.4 Application Level Performance
7.2.2 Break-down Results
7.3 Contrasting Web Search Engines
7.3.1 Traffic Profiles
7.3.2 Data Preparation Time at the Server Side
7.4 Conclusion
8 A First Characterisation of an Enterprise Traffic
8.1 Introduction
8.2 Overall characteristics
8.2.1 Backup Traffic Impact
8.2.2 Connection Characteristics
8.2.3 Throughput for Enterprise Traffic
8.2.4 Tear-down Analysis
8.3 RTT Estimation in Enterprise Network
8.3.1 Short Connection Impact
8.3.2 A comparison with Active Measurements
8.4 Service Profiling
8.4.1 LDAP
8.4.2 SMB
8.4.3 Discussion
8.5 Conclusion
9 Pinpointing and Understanding Anomalous TCP Connections in Residential Traffic
9.1 Introduction
9.2 On the Impact of Losses
9.2.1 Identifying RTO and FR/R
9.2.2 Retransmissions in the Wild
9.2.3 Studying Impact on Short and Large Transfers
9.3 Anomalies within Data Transfers
9.3.1 Methodology
9.3.2 Results
9.3.3 Zoom on clusters 1 and 3
9.4 Conclusion
10 Proposal to Locate Application Layer Anomalies in an Enterprise Environment
10.1 Introduction
10.2 Study Challenge
10.2.1 Client Access
10.2.2 How to Define Anomalous Behavior
10.3 High Quantile Metric
10.4 Outliers in Data Time Beak-down Values
10.5 Discussion
10.6 Conclusion
A RTT Stability for the Cellular, FTTH and ADSL Traces
B Data Time Break-down for Mail andWebmail Traffic
B.1 Webmail : Clustering Results
B.2 Orange Mail Service
B.2.1 ASP Mail service : a First Look
B.2.2 SMTP : Clustering Results
B.2.3 POP3 : Clustering Results
C Résumé en Français
C.1 Introduction
C.2 Description des Traces
C.2.1 Environnements Hétérogènes
C.2.2 Des Traces du FSI Orange
C.2.3 Trafic Entreprise
C.3 Revisiter les Performances des Transferts TCP
C.3.1 Connexions Bien Formées
C.3.2 Transferts Courts : Définition
C.4 Décomposition des Délais de Transfert
C.4.1 Retransmission et Libération des Connexions TCP
C.5 Impact de l’Application
C.6 Notions de Synchronisme et de Pertes de Paquets
C.7 Approche Classique pour la Comparaison de Performance
C.7.1 Principaux Suspects
C.7.1.1 Volume de Données
C.7.1.2 La Latence de l’accès
C.7.1.3 Temps de Retransmissions
C.7.2 Comment Comparer les Performances ?
C.8 Méthodologie Proposée : Etude de l’Interaction entre l’Application, le Comportement
et l’Utilisation
C.8.1 Décomposition du Temps de Transfert de Données
C.8.2 Présentation des Résultats
C.8.3 Validation par des Traces Réelles
C.9 Application pour le cas de Recherche sur Google
C.9.1 Comparaison des Débits Applicatifs
C.9.2 Résultats
C.10 Conclusion
Bibliography