Get Complete Project Material File(s) Now! »
Chapter 3: Theoretical and Experimental Analysis of Biomass Gasification at Low Temperatures (Biogas Production at 30 ⁰C)
The results of this chapter have been presented at the PSE2015/ESCAPE25 conference, Copenhagen, Denmark on 31 May – 4 June 2015 under the reference:
Muvhiiwa R*., Hildebrandt D., Matambo T., Glasser D., Theoretical and Experimental Analysis on Biogas Production, poster #302.
This is completely my work, I did all the simulations and processing of data as well as writing the paper. My supervisors assisted with the analysis of data.
Abstract
The research presents an analysis of experimental data for the different gaseous products of an Anaerobic Digestion (AD) process at a temperature of 30 ⁰C based on the thermodynamic Attainable Region (AR) obtained. The AR approach is presented; which in itself is an interesting tool for defining the limits of a given process of interest. The Enthalpy (∆H) and Gibbs Free Energy (∆G) are used to obtain the AR showing the thermodynamic limits for AD for biogas production from 1 mole of glucose. The glucose was used as a surrogate for the different biomass materials used and in this case cow dung and dog faeces. Thermodynamic results have shown that at minimum G CO2 and CH4 are produced at temperatures around 30 ⁰C. Experimental data using cow dung, glucose and dog faeces (as biomass feed) at 30 ⁰C lies close to the region were the G is minimum on the G-H AR plot. This suggests that a consortium of anaerobic bacteria operates so as to minimise G under AD provided optimum temperatures for the biological process are met. This is an important observation as it shows that the bacterial action is governed by the limits of thermodynamic laws.
Introduction
The work presented finds the AR obtained from the G-H plot for the conversion of a biomass feed (in this case assumed to be one mole of glucose) into different gaseous products namely CO, H2, CH4 and CO2. It also shows the comparison of experimental findings of AD using cow dung, glucose and dog faeces to the feasible AR obtained from thermodynamics. Thermodynamics suggests that systems and processes are feasible if ∆G is less than zero (Li et al., 2000) and operation is most favourable when ∆G is most negative (minimum G). Operating at minimum G maximises irreversibility. In chemical engineering, the bigger the ∆G, the bigger the driving force. However, although hard to ascertain, this may also mean a faster reaction and ∆G could be proportional to the speed of the reaction. Conversely, this could also mean that given enough time, time to infinity, predicted products will be formed.
The scope of this work is to compare the theoretical calculations to experimental findings obtained from biogas production. This then is an application of the AR theory to biological processes as well as biomass processes. This work is closely related to the theoretical data presented in the research by (Muvhiiwa et al., 2015) but in this case, a G-H region is plotted at 30 ⁰C and is compared to experimental findings. The calculations are intended to show how bacterial activity relates to thermodynamic limits from an H and G point of view. This work is only carried out based on an assumed optimum operation conditions for methanogen bacteria in order to try and give a better and estimated analysis.
Biogas production is an anaerobic process meaning that the process is favourable in the absence of oxygen. The biomass materials (in this case are cow dung and dog faeces) which constitute mainly of C, H and O elements. This means CH4 and CO2 gases are formed only from the elements present in the biomass material. The breakdown of elements to form gases in AD is similar to a pyrolysis process where biomass is converted into gases by heating in the absence of oxygen. Unlike in the controlled oxygen gasification process, no oxygen or other elements are added to AD and pyrolysis to help break down the biomass besides bacteria and heat respectively. This allows one to compare how the products of biomass conversion to gases change from low temperatures to high temperatures using the same feed and make a relationship between AD, pyrolysis and gasification as all forms of gasification process.
Low temperature gasification, Anaerobic Digestion
A thermodynamic analysis of low temperature AD was investigated to obtain an AR using G-H plots. The objective was to find the thermodynamic region where all reactions are possible for the biological process on where the bacterial consortium actually operates. This was investigated for the temperature at 30 ⁰C and 1 bar pressure. These conditions have been chosen because microorganisms that produce biogas generally operate under these conditions in liquid water.
As shown in the latter Chapter 2 that the minimum values of G become more negative as temperature is increased from 25 ⁰C -100 ⁰C, suggesting that the process operates better at higher temperatures. However, this does not mean that actual biogas production increases with temperature since it is the anaerobic bacteria that is important and how the bacteria will adapt to the operating temperature. Although water is in liquid/gas state around 70 ⁰C – 100 ⁰C, theoretically, biogas can be formed around this temperature. However, in practice, there is no feasibility of biogas production around these temperatures since it is the anaerobic consortium that is important and how it will adapt to these temperatures. Therefore, in the case of biogas production, the optimum temperature of 30 ⁰C, without any other factors, was considered.
Biogas production is a slow biological conversion of biomass material at low temperatures under anaerobic conditions. In general, most anaerobic bacteria in the thermophilic group have a maximum growth rate at temperatures around 70 ⁰C – 75 ⁰C (Zindler et al., 1984). The process to produce biogas is catalysed by a special group of bacteria called methanogens. Most isolated methanogens have temperature optima around 25 ⁰C, and upper temperature limits at 30-40 ⁰C (Nozhevnikova et al., 2001). According to (Uniwersytet Wroclawski., 2017), a website providing data on methanogens, many of the methanogens that feed on CO2 and H2 can operate in temperatures ranging from 20 – 40 ⁰C with optimum temperature averaging to about 30 ⁰C. A specific methanogen called Methanobacterium lacus sp. nov. was studied by (Guillaume et al., 2012) and was found to grow at a temperature range of 14 – 40 ⁰C (optimum 30 ⁰C) and at pH 5.0 – 8.6 (optimum pH 6.5) while biogas guideline data from (Werner et al., 1989) shows the suitable digestion temperature of between 20 ⁰C and 35 ⁰C. This bacterium uses H2 and CO2 for catabolic growth to produce CH4. The results by (Muvhiiwa et al., 2016) show that, for AD of cow dung and dog faeces, the final composition of CH4 produced on a nitrogen free basis was similar at temperatures of 20 ⁰C, 25 ⁰C and 30 ⁰C studied. Although the same composition was obtained for the temperatures studied, the gas production rate might be different and also that the composition of the product gas might be set by the material balance. Hence, temperature may not have much effect in the product gas concentration in this small temperature range. Nevertheless, a temperature of 30 ⁰C was chosen for experimental purposes as this would ideally provide us with better results for comparison with thermodynamic data from AR. Feed substrates of cow dung and dog faeces were used for the experiment. Cow dung is readily available in farms and carries the methanogen bacteria that help to produce biogas. If one wishes to compare other biological experimental results to the AR theorem, it would also be advisable to try and carry out the experimental work at the optimum conditions. These may include, temperature, pressure etcetera for maximum production rate for the bacterial activity to enable better contrasts.
Experimental set up for the processes.
Low temperature gasification-AD
The experimental procedure and other results obtained from (Muvhiiwa et al., 2016) at 30 ⁰C were used for this study and were compared with the thermodynamic AR plot to explore any correlations. This is because biogas production is a biological process, therefore relies on bacteria to convert solid feed to gaseous product. The mesophilic range, 20 ⁰C – 40 ⁰C is considered to produce the highest CH4 composition hence a temperature of 30 ⁰C was chosen to try and give us a good comparison with the theoretical plots. It is also assumed that the methanogen bacteria in our substrate is similar to the group of methanogens that work at optimum temperatures around 30 ⁰C hence would help give relatively close data that would allow us for better analysis.
Feed of 25 g cow dung, 25 g dog faeces and 20 g dog faeces + 5 g cow dung were investigated for biogas production at 30 ⁰C. The amount of feed substrate that was added to the flask was 10 % of the total solid contents. To relate this feed material to the G-H ARs, all the feed was assumed to be glucose hence thermodynamic data for glucose was used for the theoretical analysis. Distilled water (250 ml) was added to all flasks. Nitrogen was used to purge air out of the flasks to create an anaerobic condition. The total volume of the solution amounted to about 55 % of the 500 ml flask to accommodate for gas production. Gas composition was investigated for the flask at 30 ⁰C in water baths. The experiments were carried out for 190 days and the gas was analysed using a Gas Chromatography (GC) with CH4, CO2 and H2 gases considered for analysis. The results used for this analysis were obtained at day 82 because the gas composition was constant after this period. Batch processes were run, and gas was collected with a gas syringe through a rubber seal. The CH4 gas composition was calculated on a nitrogen free basis as shown in Eq. (3.1)
Results and Discussion
AR for anaerobic digestion at 25⁰C and 1 bar
Figure 3.2 illustrates the AR at 25 ⁰C, 1 bar when 1 mole of glucose is used as feed material and is obtained using the methods shown Section 2.1 of Chapter 2. The region of interest is where we either add or remove heat without adding work and is shown by the shaded region. It is important to note that the G must be less than zero for the overall reaction to be thermodynamically feasible when mixing is excluded. The main products of biogas production are CO2, H2 and CH4. The AR show that it is thermodynamically feasible to make CO2, H2, CH4 and CO at 25 ⁰C, 1 bar and different bacteria could work anywhere within the region but not outside the region. However, experimental research has shown that most bacteria do not favour the production of CO at these low temperatures (Danielas et al., 1977). This suggests that biological processes that produce biogas may lie on the zero CO line. It might also be assumed that the reaction will proceed to where ∆G is most negative (minimum G) in the AR because the system is likely to be more stable at this state.
From Figure 3.2 the minimum G i.e. point x, H2 and CO are zero with CH4 and CO2 as the only expected products. This corresponds to Eq. (3.2) and is where the maximum amount of CH4 can be made of which an equal amount of CO2 is produced.
AR at 30 ⁰C.
Eqs. (2.11) and (2.15) in Section 2.2.3 of Chapter 2 were used to find how the AR changes with temperature at constant pressure. The resulting AR obtained for the change in temperature from 25 ⁰C to 30 ⁰C at constant pressure of 1 bar is shown in Figure 2.3. The AR for the temperature studied in Figure 2.3 show that the products formed at minimum G are quite distinct from the other products in the system. Hence, mixing was not considered. The material balance at minimum G at 30 ⁰C is shown by Eq. (3.3).
Experimental vs theoretical results at 30 ⁰C.
In theory, it is possible to make biogas in the temperature range 25 ⁰C to 100 ⁰C. However, there is no feasibility of biogas production at 100 ⁰C or near this temperature as it is difficult to imagine how a boiling digester would operate and considering that bacteria may be denatured at these temperatures. Hyperthermophilic AD occurs around 70 ⁰C where the bacteria have maximum growth. Also, it should be noted that biogas can be produced at temperatures below 25 ⁰C but in this analysis an optimum temperature of 30 ⁰C was considered for analysis.
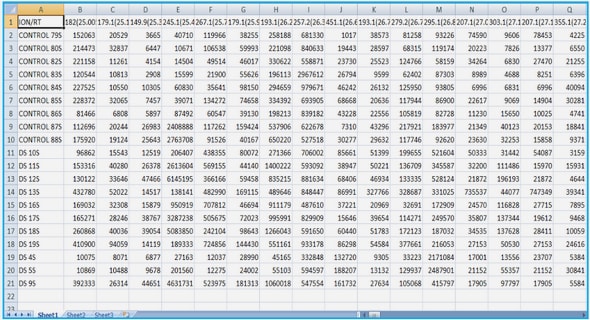
Table 3.1 shows experimental data that was plotted on the thermodynamic AR. The experimental method and other results were obtained from AD of cow dung and dog faeces at 30 ⁰C over a period of 82 days (Muvhiiwa., et al 2016). Figure 3.4 typically shows the diagram for AD of cow dung and dog faeces from which data used to compare with the AR results was obtained. This plot was similar to the other two substrates. CH4, CO2 and H2 gases were produced in significant quantities during this experiment. No CO was observed in the GC analysis.
The results in Table 3.1 show the concentration of CH4, CO2 and H2 in the biogas produced after a period of about 82 days. The highlighted results were carried out by the researcher while the other results are from published data by Muvhiiwa et al., 2016. The results in Table 3.1 for AD of glucose shows a 1:1 ratio of CO2 and CH4 and were obtained from experiments carried out by Kalyuzhnyi and Davlyatshina (1997). The glucose results gave a carbon balance of 80 % suggesting that the balance of 20 % went on to form cells as alluded by the authors.
The results with the asterisk (*) in Table 3.1 are the same results shown in Figure 3.4. It is important to note that the concentrations at the end of the experiment were considered but not the intermediate processes. Also, this was on a nitrogen free basis.
This experiment was carried out for 199 hours at a pH of 7 and temperature of 35 ⁰C. The concentrations were normalised to give results for 1 mole of glucose feed and the material balances were used to calculate the ∆H and ∆G for the respective substrates. The process for normalising the experimental data to AR conditions and obtaining the G and H for the experimental work is shown in Eq. (3.4) and Eq. (3.5). Considering the experiment where 25 g of dog faeces digested (glucose as surrogate in the calculation), the mole balance becomes:
The values of ∆G and ∆H in Eq. (3.5) were plotted on the AR to give a point and the same analysis was done for the other substrates, assuming they were glucose. All the substrates used were not characterised. Although protein and lipids are present in cow dung and dog faeces, it was assumed that the composition of these is low compared to the composition of the carbohydrates. Another major assumption was also to consider the overall material balance for producing H2, CH4 and CO2 and not consider intermediate steps.
Figure 3.5 shows the relationship of the experimental data and theoretical calculation on the thermodynamic AR at 30 ⁰C. Some of the experimental plots in Figure 3.5 lie on top of each other (cow dung and glucose) as the heat and work requirements were similar therefore there are four points instead of the two that are visible. These experimental results are compared to the theoretical data in Figure 3.5, assuming the experimental substrates (cow dung and dog faeces) had the same structure and thermodynamic properties as that of glucose. The assumption is also because the first stage of the AD process (hydrolysis) converts the main elements of biomass into simple sugars; (C6H12O6) one of which is glucose. Also, we have thermodynamic data of G for glucose, with no data for the biomass material used. The results show that experimental data lie towards the region that minimise G at 30 ⁰C. This, therefore, suggests that the bacteria operate so as to minimise G in the AD process.
Biogas production is a biological process. Hence, the process is dependent on bacteria. If one wants to obtain a greater concentration of a specific product like H2 or CO, specific bacteria that produce H2 or CO only, must be chosen so as not to compete with the methanogen bacteria. Furthermore, it would need a lot of heat from the environment. Also, some of the gases produced may dissolve in the liquid water depending on their solubility at 30 ⁰C although in very small quantities. This is difficult to analyse in the biological system. Therefore, the overall concentrations recorded at the end of the experiment were used without considering solubility. This is because it was assumed that the small amount of water used (250ml) was saturated at the initial production stages. Considering that the solubilities for CO2, CH4 and H2 at 30 ⁰C (101.325 kPa) expressed as a mole fraction are 5.41 × 10⁻⁴, 52.346 × 10⁻⁴ and 1.377 × 10⁻⁵, Gevantman (2003) respectively and that the process was run for a long time, the quantities of gases dissolved may be neglected in favour of the amount produced.
It is hypothesised that in a system with a consortium of bacteria, the bacteria that can get the system to the minimum G and release the most work will typically grow more cells and dominate eventually. This may not be a single species but could be a set of bacteria where each can benefit from the products of the previous one. The results also suggest that the drivers in biology are to minimise G and if one has a consortium of bacteria and leave things to develop, the set that minimise G dominates. This result is very important to consider when designing digesters for anaerobic processes. If some consortia of bacteria are present in the digester, the specific set of bacteria that can, in the end, minimise G may tend to dominate. In this case, the methanogen bacteria that produce CH4 will usually dominate those that produce H2. Other bacteria may still be present in the digester but the set that can get to minimum G have the most available free energy to work with and will tend to dominate.
While the actual result from the AR shows that there will only be CH4 and CO2, we can see that the experimental results also show production of a significant amount of H2. However, the presence of the H2 hardly affects the position of the minimum on the diagram and this suggests that the effect of mixing could play a reasonable part in determining the final composition. It is probably not worth pursuing this point further at this stage considering the absence of the correct G and H for the feed substrate.
Table of Contents
Declaration
Abstract
Dedications
Acknowledgements
List of Figures
List of Tables
List of Abbreviations
Definition of terms
Chapter 1: Introduction and Background
1.1. Background and Motivation
1.2. The Challenge
1.3. The Approach
1.4. The Attainable Region (AR)
1.5. AD, pyrolysis and gasification
1.6. Plasma pyrolysis/ gasification
1.7. Thesis Outline
References
Chapter 2: Applying Thermodynamics to Digestion/Gasification Processes: The Attainable Region Approach
Abstract
2.1. Introduction
2.2. Theoretical Procedure
2.3. Results and Discussion
2.4. Summary
References
Addendum Chapter
2.1A. Introduction
2.2A. Theoretical procedure for gasification AR
2.3A. Results and discussion for G-H AR for gasification processes
2.4A. Summary
References
Chapter 3: Theoretical and Experimental Analysis of Biomass Gasification at Low Temperatures (Biogas Production at 30 ⁰C)
Abstract
3.1. Introduction
3.2. Experimental set up for the processes.
3.3. Results and Discussion
3.4. Summary
References
Chapter 4: Study of the effects of temperature on syngas composition from pyrolysis gasification of wood pellets using a nitrogen plasma torch reactor.
Abstract
4.1. Introduction
4.2. Process materials and experimental method
4.3. Results and Discussion
4.4. Summary
References
Chapter 5: Plasma gasification of wood pellets with oxygen using a nitrogen plasma torch: Analysis of material, heat and work balances.
Abstract
5.1. Introduction
5.2. Experimental Procedure
5.3. Results and discussion
5.4. Plasma Gasification Energy Efficiency
5.5. Summary
References
Chapter 6: The Impact and Challenges of Sustainable Biogas Implementation: Moving Towards a Bio-Based Economy.
Abstract
6.1. Introduction
6.2. Methods
6.3. Results
6.4. Discussion
6.5. Summary
References
Chapter 7: Conclusions
7.1. The Attainable Region (AR) approach to targeting
7.2. Experimental Results
7.3. Final thoughts and recommendations
GET THE COMPLETE PROJECT